UI Tests and Code Coverage Data
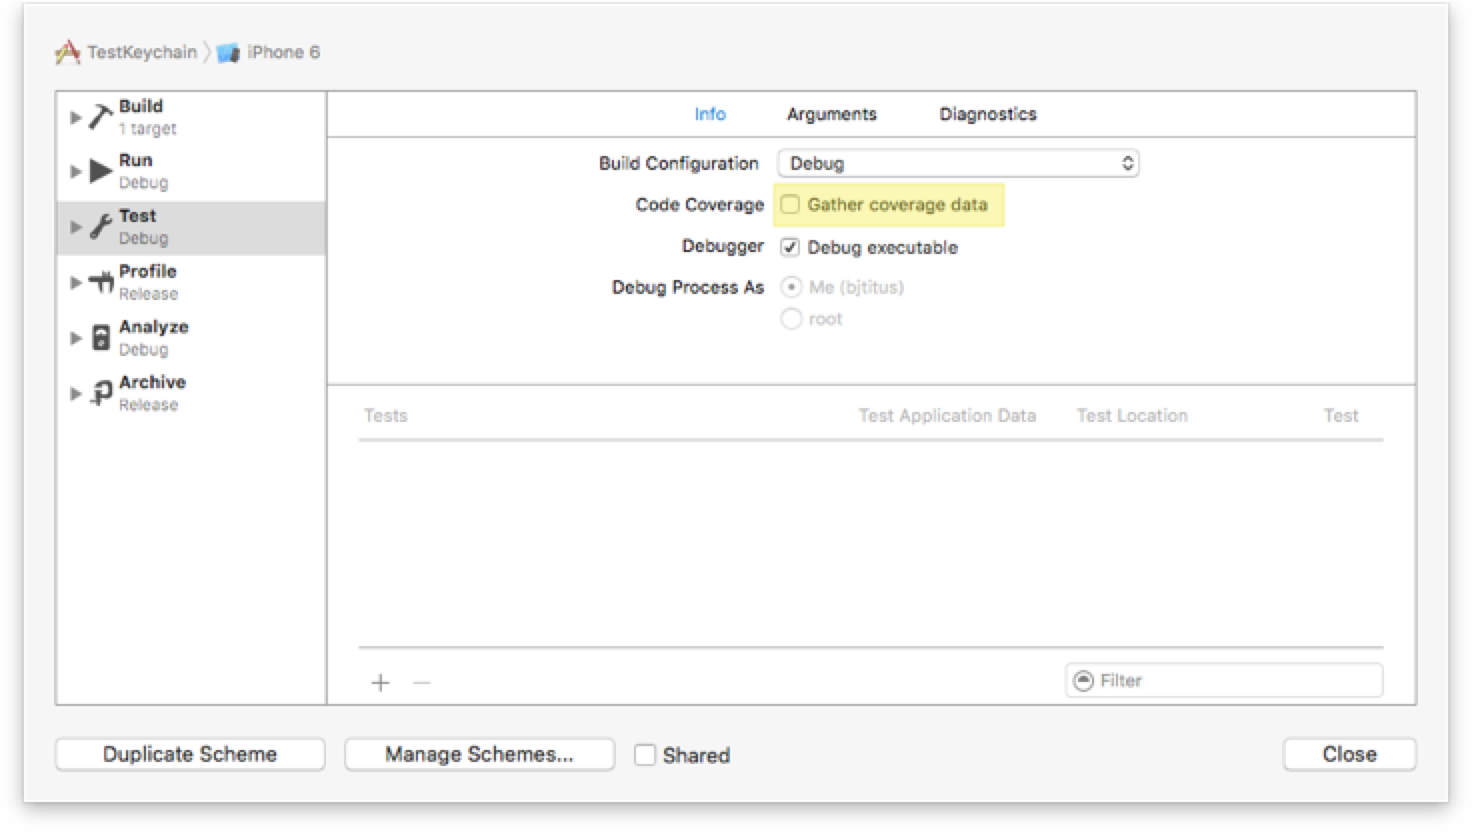
I recently implemented UI Tests in our application and added code coverage to our existing unit tests. There were a few issues we ran into while setting these features up. Many projects may just be able to check the “Gather Code Coverage Data” checkbox, but others may need special setup.
Non-debug Configurations
The debug configuration has several build settings necessary to the proper configuration of UI Tests and Code Coverage. We have several different configurations used for testing different backends that were much closer to a production configuration. I didn’t see any of these items mentioned in the documentation but they are vital to making Code Coverage run properly.
UI Tests
- If using @testable, make sure
ENABLE_TESTABILITYis set to Yes on Application Target
Code Coverage
- If you are using Swift, make sure that the Application target has “Defines Module” set to Yes under Packaging.
- Make sure you are only building active architectures. Code coverage apparently fails if multiple architectures are built.
- Make sure to set “Enable Code Coverage Support” in the Application target to YES or Objective C files will not appear in Code Coverage reports.
Swift Profiling Compiler Bugs
We discovered a Swift compiler bug that appears to only happen when profiling is enabled.
You will see the dreaded “Segmentation fault: 11” and notice a SILGenProfiling class and walkForProfiling function being called.
It turns out that class variables (mutable var or immutable let) with ternary expressions (isTrueOrFalse ? "isTrue" : "isFalse") fail to compile with profiling enabled. (Radar #23256795)
In all of the WWDC sessions and documentation, Apple seems to imply that checking the “Gather Coverage Data” box should just work, unfortunately, only the debug configuration seems to be set up with the proper settings by default. Hopefully this information can help you work around some of these issues.